Colorful Graph UI
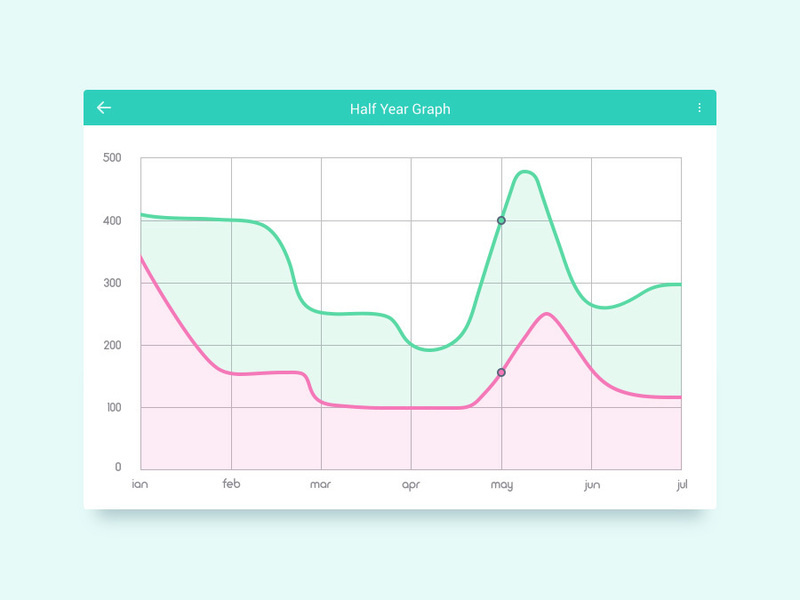
Go and do your statistic with this free UI Kit from EpicCoders that features two graphs in simple but functional designs to measure your hindsight in whatever areas of your interest or concerns.
Whether you want to have clear-cut view of your earnings from the stock markets, profits, grades, number of your subscribers or eve to track you achievements and task daily or weekly, this UI kit can help you sort it all with a graph that will visualize and help you assess your activities. All you need is to input the data it needs to track down the necessary stats and analytics. Download it now and enjoy!
You may want to check all the files in the kit before you download it.
Your feedback and opinions are very important to us! Should you have a question, concern or suggestion - don't hesitate to reach us out on our social media pages and we'll answer as soon as we can.
- Facebook - https://facebook.com/epiccoders.co/
- Twitter - https://twitter.com/CoEpic
- Instagram - https://www.instagram.com/epicpxls/
You may also email us at contact@epicpxls.com
Thank you and enjoy designing!
EpicPxls ❤️


JOIN US
COMPANY
Earn 85% and
more on all sales
Upload your products and put them up
for sale at whatever price you want.
Join our newsletter and receive an instant gift
YOU WILL RECIEVE FREE AND PREMIUM PRODUCTS EACH WEEK.
